Look up the fund factsheets of the largest fixed income unit trusts, and there is a good chance you will spot a bank debt among their top ten holdings. Professional fund managers are frequent buyers of bank debt as these fixed income securities pay decent coupon rates for manageable risks.
High-yield bank capital instruments have increasingly become an essential part of a bondholder’s portfolio. Unlike most high-yield debt from non-financial firms with relatively weak credit profile, such structural high-yield securities like bank capital instruments are often issued by big corporations with strong capital position. The bonds are also actively traded in the secondary markets as evident by their narrower bid-ask spreads.
Singapore banks, like their international counterparts, have been active issuers of such high yielding perpetual notes and Tier 2 capital instruments as part of Basel III requirements after the last financial crisis. These securities pay a coupon rate that is correlated to their credit rating. Because of their loss-absorbing structure and subordinated rank, the notes are regularly assigned credit ratings by rating agencies that are a few notches lower than the banks’ issuer ratings.
While some find those bank capital requirements a drag on profitability, Singapore banks are in a better shape since 2008. Institutions are better capitalized and more resilient, and asset quality has improved on the back of a growing global economy. The Singapore banking sector has remained resilient in the face of an increasingly uncertain macroeconomic and geopolitical landscape.
The three local banking groups, DBS Group Holdings Ltd (“DBS”), United Overseas Bank Limited (“UOB”) and Oversea-Chinese Banking Corporation Limited (“OCBC”) reported healthy loan growth and an improvement in loan quality in recent quarters. Despite the slowing economy and low interest rate environment, we think some of their debt are priced attractively.
Interest income increased in 3Q19
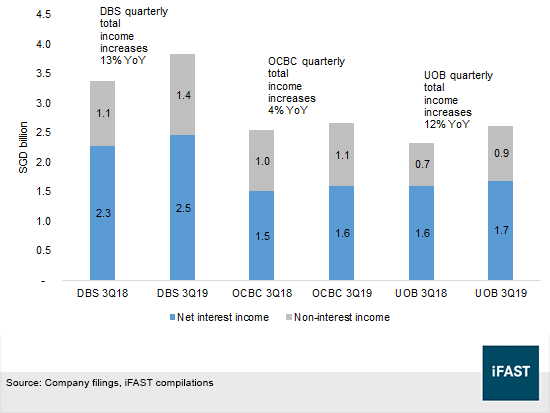
Singapore banks reported higher total income in 3Q19 on the back of increased net interest and non-interest incomes (see Figure 1). DBS and UOB registered respective gains of 13% YoY and 12% YoY as non-interest income increased 24% YoY and 27% YoY respectively. OCBC grew total income by 4% YoY, with the underperformance coinciding with lower profit from its life insurance unit, whose profit dropped 18% YoY to S$151m in the third quarter.
Interest incomes made up the majority of the banks’ total income. Approximately 60% of OCBC’s total income in 3Q19 was derived from interest-earning assets, slightly lower than DBS (64%) and UOB (65%). With an average interest-earning asset value of S$515 billion in 3Q19, DBS had the largest interest-generating portfolio among the three lenders.
Figure 1: Total quarterly incomes of the three Singapore banks
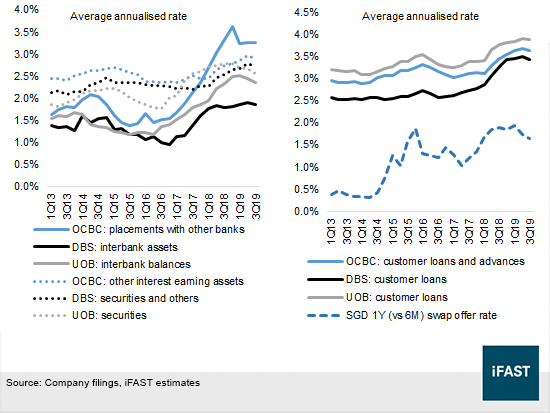
Interest-bearing
assets were broadly classified into three groups on the balance sheet — loans
to non-bank customers, interbank assets and interest-yielding securities. The
returns from non-bank loans were by far the highest as the annualized average
rates on customer loans ranged from 3.4% to 3.9% in 3Q19 (Figure 2b; right),
exceeding the annualized average rates of between 1.9% and 3.3% on interbank
assets and securities (Figure 2a; left).
In general, average rates on interest-earning assets have been on an uptrend since 1Q13, although rates have only seen a meaningful increase since 1Q17 after falling slightly in 2016. Concurrently, we noticed that the movement in average rates on customer loans (Figure 2b) moved in tandem with the SGD swap offer rate, suggesting that the rate on customer loans may have peaked in the second quarter with the 1-year SGD swap rate trending lower since then.
With respect to the average rates of individual banks, we observed that DBS has consistently registered the lowest return on interest-generating assets, be it on rates for interbank balances, securities or customer loans, possibly due to a significantly larger asset base. As disclosed in its latest filing, DBS made S$3.0 billion of interest income on S$354 billion of customer loans during 3Q19, whereas OCBC and UOB earned S$2.3 billion and S$2.6 billion of interest from S$257 billion and S$271 billion of loans.
The disclosures of interest rate risk in the banking books provide a rough idea of potential impact from interest rate movements on the banks’ non-trading portfolios. According to OCBC’s 2018 disclosures, a 100-basis point parallel rise in yield curves on the lender’s exposure to major currencies would increase its net interest income by 12.6%. In the examples of UOB and DBS, we estimate that a 100-basis point parallel shift in interest rates would impact annual net interest income by ~12.5% and ~13.6% respectively.
Non-interest income may drive total income in a low rate environment
Lenders increasingly earn a higher proportion of their total income from non-interest activities. In aggregate, the proportion of non-interest income of the three Singapore banks increased from 34% in 3Q18 to 37% in 3Q19, generally on higher trading income, brokerage commission and fee revenue. Other non-interest activities include gains on investment securities, investment banking, securitization activities, and insurance businesses.
If interest rates continue to remain low, the banks may continue to recognize a higher proportion of earnings from non-interest income. A higher share of non-interest income could help banks diversify their earnings structure, thereby becoming less dependent on interest rate movements. While elevated trading and underwriting activities are typically associated with a higher measure of market risk, income from interest-generating assets, which are more stable, still accounted for more than 50% of the lenders’ total income.
Furthermore,
we view the shift to increase non-interest income as a natural response to the
upcoming competition for deposits. In June 2019, the Monetary Authority of
Singapore (“MAS”) announced plans to issue digital bank licenses that will allow non-banking players to conduct digital banking businesses in
Singapore. This means that in the near future, digital banks would be allowed
to receive deposits from retail customers.
Figures 2a and 2b: Annualized average rates on interest-bearing assets
Geographical distribution of the banks’ loans
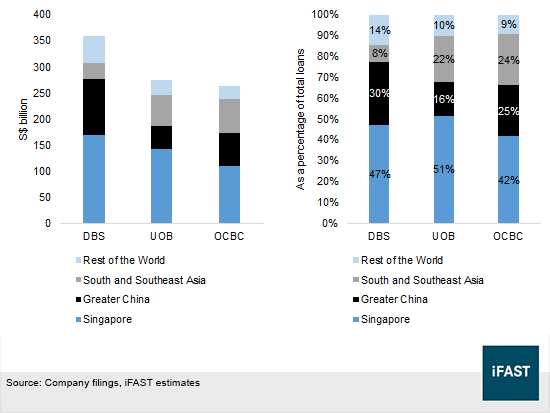
The geographical exposures of the Singapore banks in terms of their loans have largely been restricted to Singapore, Greater China, South Asia and Southeast Asia (Figure 3). UOB and OCBC have a large loan book in Southeast Asia, with a substantial loan exposure in Malaysia (UOB: S$29 billion; OCBC: S$29 billion) and Indonesia (UOB: S$12 billion; OCBC: S$20 billion). UOB also has a notable presence in Thailand with approximately S$19 billion of customer loans as of end-September. The lender first entered Thailand through its acquisition of Radanasin Bank in 1999, which it later merged with Bank of Asia in 2005.
Greater China, comprising Hong Kong, mainland China and Taiwan accounted for the banks’ largest international exposure. As can be observed from Figure 3, DBS had a sizable exposure to the region, with nearly 30% of its loan book in Greater China. Hong Kong, which is in a recession, made up 15% of the bank’s total loan book but CEO Piyush Gupta told CNBC in November that the bank was not “seeing any stress in the portfolio, as delinquencies are not picking up and the portfolio is extremely well secured.” In response to the economic slowdown, the Hong Kong government has relaxed mortgage rules to improve home ownership, although lenders are reportedly tightening up their lending standards.
Figure 3: Customer loans by region as of 3Q19
Asset quality
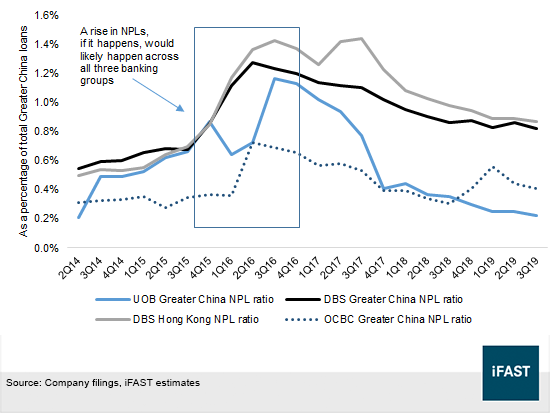
The low delinquency rate in Hong Kong is reflected in DBS’s non-performing loan (“NPL”) ratio in the city (Figure 4), which measures the value of NPLs to total loan book value. NPL ratios may be seen as a measure of a bank’s loan quality. A heightened level of NPLs is typically associated with higher funding costs as counterparties require higher risk compensation to transact with banks with elevated NPL levels. The negative market sentiment towards these lenders could decrease the banks’ ability to access liquidity sources and capital markets.
As we observed in the last few quarters, the ratio of non-performing loans in Greater China for DBS and UOB had been declining and remained low up till the end of 3Q19. The one exception was OCBC, whose Greater China NPL ratio had seen a modest increase from 0.3% in 3Q18 to 0.6% in 1Q19, before dropping to 0.4% in 3Q19. However, OCBC CEO Samuel Tsien said in November “there was no indication that there are any stresses” nor was “there any noticeable deterioration in the bank’s portfolio quality”.
Despite the slight uptick in its Greater China NPLs, OCBC had planned for a five-year target to grow its business in the Greater Bay Area (“GBA”) — an area made up of nine cities in the Guangdong province known as the Pearl River Delta, Hong Kong and Macau. OCBC expected its GBA loan value to increase from S$45 billion in 2018 to S$80 billion in 2023, and its profit from the region to increase from S$558m to S$1 billion over the same period.
Figure 4: Non-performing loan ratios in Greater China
Greater
China accounted for only a section of the banks’ total loan exposures. From a
broader perspective, aggregate asset
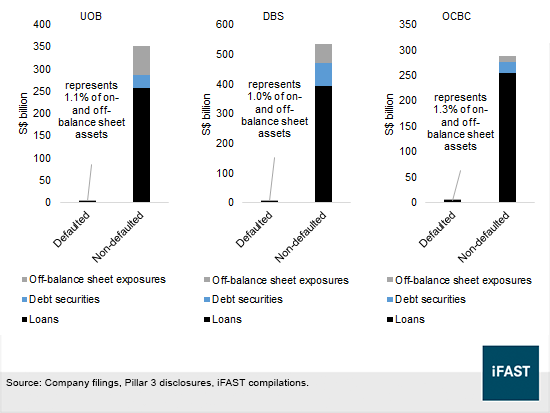
quality measured by Basel III standards showed that defaulted exposures were low, making up less than 1.5% of on- and off-balance
sheet exposures at the end of 2018 (Figure 5). In aggregate, OCBC had the
highest proportion of defaults among the three lenders, with S$3.9 billion of
defaulted loans, bills receivables, debt and off-balance sheet items. During
2H18, OCBC disclosed that nearly S$1.2 billion of loans defaulted, while the
group wrote off S$397m of borrowings.
Figure 5: On- and off-balance sheet exposures (31 Dec 18)
Banks set aside allowances to account for defaulted and non-performing loans. When estimating the amount of specific allowances to make, lenders essentially take into account the difference between the borrower’s financial obligation and its repayment ability, which is in turn a function of factors like the impending economic outlook, profitability and collateral liquidation value. General allowances, on the other hand, are determined for inherent estimated losses that are not identifiable to individual financial assets by the banks’ management.
Collectively, total allowances including regulatory loss allowances across all three Singapore banks, were at least 180% higher than the value of their unsecured non-performing assets (NPLs plus non-performing debt, contingent liabilities and others). OCBC’s 242% allowance ratio as at 30 Sep 19 was by far the highest, exceeding UOB’s 210% and DBS’s 181%. With loan loss provisions at nearly twice the level of unsecured problem loans, we think the three banks have strong loan loss coverage to cushion a blow from unexpected credit losses. We consider the high loan loss provisions as indicative of low asset risk so there is minimal asset quality concerns at this point in time.
Industry trends in the banking system
Local and foreign banking groups operating in Singapore are regulated by the MAS, which monitors the health of the banking system. Lenders in the banking system are highly interconnected as they borrow and lend to each other. If a bank fails to pay another institution on time, the delay may disrupt the counterparty’s settlement with yet another third-party bank. This may create a knock-on effect that could hold up payments in the system, thereby threatening the stability of the whole financial system. What this implies is that the credit profiles of the three local banks are intricately linked to the strength of the financial system.
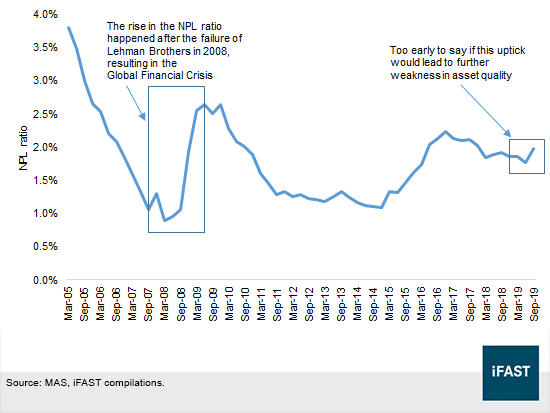
Non-performing loans in the banking system are monitored by MAS every quarter (Figure 6). As mentioned earlier, a rise in and abnormally high proportion of NPLs are often credit negative that can lead to a systemic problem, especially when a sharp rise in NPLs weakens the resilience of the banking sector to shocks. An upswing in NPLs, if it happens, would likely be synchronous across all three banks, as was what happened during 2016.
Figure 6: The asset quality of Singapore’s banking system
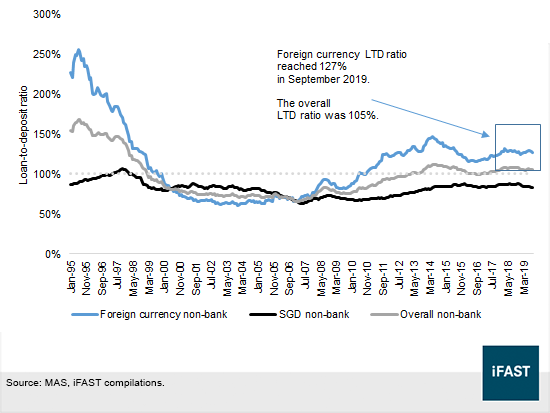
Apart from non-performing loans, the central bank also tracks the loan-to-deposit (“LTD”) ratio of the banking system. Lenders with a considerable amount of loans relative to their deposits could be seen as aggressive lenders. These banks may have lower lending standards and invest in riskier assets with higher returns to offset the higher cost of borrowing non-deposit funds.
With a LTD ratio of 129% in September 2018, the proportion of foreign currency non-bank loans to deposits was flagged by MAS as a sign of concern in late 2018, and had remained elevated at 127% in September 2019. However, the overall non-bank LTD ratio would be 105% if we included SGD loans and deposits. Referring to their financial disclosures in 3Q19, OCBC, DBS and UOB reported LTD ratios of 86.8%, 88.3% and 89.3% respectively at the end of September.
Figure 7: Loan-to-deposit ratio in Singapore’s banking system
One explanation for the low LTD ratios among local banks is the provision of deposit insurance by the Singapore Deposit Insurance Corporation for up to S$75,000 per bank per person. The insurance coverage was in fact lifted to S$75,000 from S$50,000 in April 2019, which was a positive development for bank bondholders. These insured domestic deposits could be regarded as a stable source of funding for domestic banks as insured depositors will probably not withdraw their money at the first sign of bank distress.
The overall LTD ratio for the banking system was residing at a seemingly high level of 105% in September, but remained healthy in our opinion. Although banks with high LTD ratios were perceived to possess a high risk of a bank run in the past, a LTD ratio of more than 100% is the norm among large foreign banks now.
For one, many foreign banks have easy access to funds from multiple non-deposit sources such as their own central banks, and money market instruments such as commercial papers and other short-term funding notes. Secondly, customers, especially in Europe, are more incentivized to move their savings away from banks and into higher yielding securities with the low interest rate environment.
Domestic systemically important banks, resolution planning and their implications for bondholders
In response to the Basel Committee’s recommendations for creating rules for domestic systemically important banks (“D-SIBs”), MAS published the framework for identifying and supervising of banks regarded as too-big-to-fail in 2015. Seven D-SIBs, namely DBS, OCBC, UOB, Malayan Banking Berhad, Citibank, Standard Chartered Bank and The Hong Kong and Shanghai Banking Corporation (“HSBC”), were “assessed to have a significant impact on the stability of the financial system.” The latter four are foreign banking groups and have locally incorporated subsidiaries in Singapore. Among them, Standard Chartered Bank, Citibank and HSBC are also classified as global systemically important banks by the Financial Stability Board.
Locally incorporated D-SIBs are subjected to the resolution regime of MAS. According to the 2017 and 2018 documents on the resolution of financial institutions, the central bank has the right to bail-in the liabilities of both locally-incorporated banks and holding companies that have at least one bank subsidiary. Filtering through the list of details in the documents, we think these are the few important points for bondholders.
1) The definition of bail-in-able instruments refers to: (a) any equity security that represents a legal or beneficial ownership in the issuer but excludes ordinary shares; (b) an unsecured debt that is subordinated to unsecured creditors’ claims of the issuer that are not so subordinated; or (c) any type of security that provides the right to be written down, cancelled, modified, converted into shares or other types of ownership in specific circumstances.
2) If a bail-in-able bond is partially secured, only the unsecured portion will fall within the scope of MAS’s bail-in powers.
3) Derivatives, vanilla senior perpetual securities, senior convertible bonds and senior exchangeable bonds, options and warrants are not bail-in-able.
4) The bail-in provisions apply to securities issued on or after 29 Nov 18.
5) MAS has implemented a no creditor worse-off than in liquidation compensation framework that provides creditors the right to compensation if they receive less in resolution than what they would have received in liquidation.
6) In the event of a resolution of a financial institution, it is projected that losses will be imposed on its shareholders and unsecured subordinated creditors to the fullest extent possible.
Even though it is the MAS’s intention to rely on the banks’ regulatory capital instruments (such as contingent convertibles) as the primary form of loss-absorbing capacity for the banks, the central bank may still provide temporary liquidity to support the banks in the event of a bank resolution. A resolution fund could be set up to facilitate the resolution process and the initial cost in resolving the financial institution will be recovered later from the financial sector. With this in mind, we think it is likely that there will be sovereign support for Singapore banks at the point where their viability is threatened.
The provision of emergency liquidity assistance (“ELA”) is an extension of this extraordinary support. Under the Monetary Authority of Singapore Act (Cap 186), MAS is able to offer loans or advances to banks in the context of restoring stability and public confidence in the financial system. This assistance may come in the form of a liquidity facility to specific groups of banks or, bespoke loans to troubled D-SIBs so that lenders may obtain funding in distressed situations. The establishments of the resolution planning regime and ELA frameworks are credit positive for bondholders in our view.
Market and trading risk
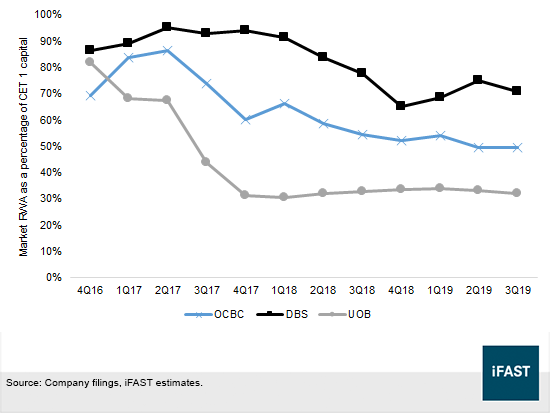
The ratio of the banks’ market risk-weighted assets (“RWA”) to Common Equity Tier 1 (“CET 1”) capital forms part of our assessment of the banks’ solvency risk. As a general rule, the bank’s solvency profile is threatened if the positions in its portfolio lead to large losses arising from movements in market prices. According to the Basel Committee on Banking Supervision, high market risk is typical of investment banks and commercial banks with trading activities.
A volatile or an elevated level in the market RWA-to-CET 1 ratio represents significant trading risk. Comparing the three lenders (Figure 8), we observed that the ratios were less than 100%, meaning the banks have low trading risk. The ratios have been on a downtrend, with OCBC and UOB witnessing a marked drop in their RWA-to-CET 1 ratio between 2Q17 and 4Q17.
The denominator of the ratio — the amount of CET 1 capital — has largely been on an uptrend during this period, while its numerator — market RWAs — has gone in the opposite direction, resulting in overall lower market RWA-to-CET 1 ratios. We suspect that the lower market RWAs are a result of lower interest rate risk. Nonetheless, DBS retained the highest trading risk with a market RWA-to-CET 1 ratio in excess of 70% as at 3Q19.
The high trading activity of DBS was also reflected in its income statements, as net trading income for the bank climbed from S$354m in 3Q18 to S$431m in 3Q19. The bank’s net trading income represented 11% of DBS’s total income in the recent quarter, which was the highest among the three lenders. In comparison, OCBC’s and UOB’s net trading incomes made up 7% and 8% of their respective total income in 3Q19.
An additional measure of market risk is the percentage of derivatives exposure over CET 1 capital. Comparing the three banks, DBS again had the highest derivative exposure among Singapore banks. As of 3Q19, total derivative exposures were equivalent to 74% of DBS’s CET 1 capital, exceeding that of OCBC (43%) and nearly twice as high as UOB (40%).
Figure 8: Market risk-weighted assets over CET 1 capital
Singapore banks have high capital adequacy ratios
The Singapore banks’ capital adequacy ratios were well above regulatory requirements. With effect from 1 Jan 19, Singapore banks have to keep their ratio of CET 1 capital to risk-weighted assets above 11.5% (assuming the highest countercyclical buffer is applied at both the group and bank level). CET 1 capital, which consists mostly of common equity, is the highest quality of regulatory capital as it absorbs losses immediately when they occur.
As of 3Q19, DBS, UOB and OCBC had CET 1 ratios of 13.8%, 13.7% and 14.4% respectively (see Table 1). All their capital ratios topped MAS requirements, including other Basel III capital and liquidity measures. For example, the banks’ liquidity coverage ratio (“LCR”) and net stable funding ratio (“NSFR”) were comfortably higher than regulatory minimums. Even the capital ratios of the foreign subsidiaries of OCBC exceeded MAS requirements, although the bank pointed out that these ratios were calculated in accordance with banking rules in other jurisdictions.
Table 1: Key prudential regulatory metrics as of 3Q19
|
|
CET 1 ratio (%) |
Tier 1 ratio (%) |
Total CAR (%) |
LCR (%) |
NSFR (%) |
Leverage ratio (%) |
|
Oversea-Chinese Banking Corporation Limited |
14.4 |
15.1 |
17.0 |
152 |
110 |
7.6 |
|
OCBC Wing Hang Bank Limited |
13.6 |
15.9 |
18.2 |
N.A. |
N.A. |
N.A. |
|
OCBC Bank (Malaysia) Berhad |
13.5 |
14.7 |
17.3 |
N.A. |
N.A. |
N.A. |
|
Bank OCBC NISP |
17.6 |
17.6 |
18.6 |
N.A. |
N.A. |
N.A. |
|
DBS Group Holdings Ltd |
13.8 |
14.7 |
16.4 |
131 |
110 |
7.0 |
|
United Overseas Bank Limited |
13.7 |
15.0 |
16.9 |
146 |
107 |
7.6 |
|
Minimum regulatory requirement (assuming maximum countercyclical buffer applied) |
11.5 |
13.0 |
15.0 |
100 |
100 |
3.0 |
|
Source: Company filings, iFAST compilations |
||||||
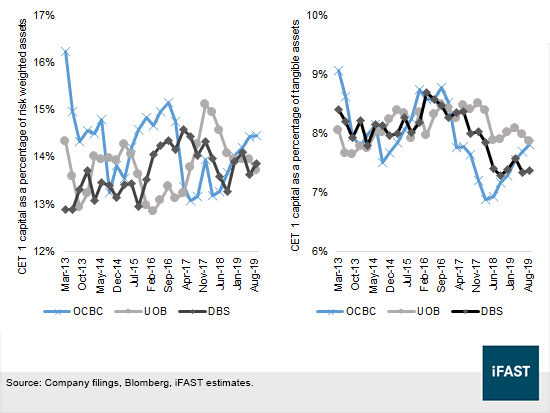
Singapore lenders have maintained their CET 1 ratios above 12.5% between 1Q13 and 3Q19. It is evident from Figure 9a that the ratios appeared to exhibit a modest uptrend when they are benchmarked against risk-weighted assets. However, Figure 9b showed that the banks’ ratios of CET 1 capital to tangible assets have dropped since 3Q16, suggesting that the banks’ capital position actually weakened since 2016.
The tangible asset ratio is an unweighted perspective of capital adequacy that is not subject to regulatory adjustments. Tangible assets do not take into account off-balance sheet items that could include higher risk derivatives, but (as compared to RWA) they place more weight on safer instruments such as government bonds. Unlike risk-weighted assets, tangible assets do not factor in risk adjustments that are reliant on the bank’s internal models and assumptions.
Despite the deterioration in the CET 1-to-tangible assets ratio, we do not feel that there is a need for concern as the banks’ capital adequacy ratios are higher than many of their international peers (see Table 2). Within the Singapore banking sector, we think that DBS has the weakest capital position as it has the lowest proportion of CET 1 capital.
Figure 9: CET 1 ratios using risk-weighted and unweighted methods
Singapore banks have met the minimum leverage ratio
Over in the US, bankers have lobbied for easier capital regulations, especially with regard to the Basel III leverage ratio — a measure of tier 1 capital relative to total leverage exposure on the balance sheet and certain off-balance sheet exposures. The banks argued that the capital standards were too onerous for them to conduct certain activities like lending in key markets performed at the subsidiaries. Lenders in Singapore, on the other hand, have little difficulty meeting regulatory standards with leverage ratios reaching more than twice the 3% minimum set by the MAS.
Among the global systemically important banks (“G-SIBs”) in Table 2, leverage ratios among Singapore, Chinese and US banks were distinctly higher than European banks, although individual banks may not be perfectly comparable due to the different banking rules in various jurisdictions. If we examined lenders that were supervised under the same regulator, for instance by just comparing European banks, we infer that Deutsche Bank was likely the weakest capitalized bank among its peers.
Access to capital remains healthy
Beyond relying on the ELA framework and resolution regime for capital support while in distress, the banks’ ability to attract capital on a continual basis is a testament of a healthy credit profile. Quite instinctively, the bank’s credit quality is likely to weaken if it is unable to source for new capital. For a publicly listed bank, we can look at its market capitalization over book value as a proxy for its capital-raising ability. The higher the bank’s market capitalization relative to its book value (or the price-to-book ratio), the easier it is for the lender to secure external funding.
Referring back to Table 2, the price-to-book ratios of Singapore banks are modestly higher than most other G-SIBs. As a matter of fact, the book values of many publicly listed G-SIBs surprisingly exceeded their market capitalizations. The few exceptions are JP Morgan Chase, Bank of America, Wells Fargo, RBC, BNY Mellon and State Street, with the latter two being large providers of custody and trustee services.
Table 2: Selected financial ratios for Singapore banks and G-SIBs
|
Bank |
CET 1 over tangible assets |
CET 1 over RWA |
Market cap over book value (as of 20 Nov 19) |
LCR (%) |
Leverage ratio |
|
DBS |
7.4% |
13.8% |
1.3x |
131 |
7.0% |
|
UOB |
7.9% |
13.7% |
1.1x |
146 |
7.6% |
|
OCBC |
7.8% |
14.4% |
1.0x |
152 |
7.6% |
|
JP Morgan Chase |
6.9% |
12.3% |
1.5x |
113 |
6.3% |
|
Citigroup |
7.0% |
11.6% |
0.8x |
121 |
6.5% |
|
Deutsche Bank |
3.1% |
13.4% |
0.2x |
140 |
3.9% |
|
HSBC |
4.5% |
14.3% |
0.8x |
154 |
5.4% |
|
Bank of America |
7.2% |
11.4% |
1.1x |
116 |
6.6% |
|
Bank of China |
7.0% |
11.2% |
0.5x |
140 |
7.6% |
|
Barclays |
3.3% |
13.4% |
0.5x |
151 |
4.8% |
|
BNP Paribas |
3.2% |
12.0% |
0.6x |
132 |
4.0% |
|
Goldman Sachs |
7.5% |
13.6% |
0.9x |
127 |
6.2% |
|
ICBC |
7.9% |
12.9% |
0.8x |
121 |
8.1% |
|
Mitsubishi UFJ FG |
4.6% |
12.7% |
0.4x |
141 |
4.9% |
|
Wells Fargo |
7.6% |
11.6% |
1.2x |
121 |
7.4% |
|
Agricultural Bank of China |
6.9% |
11.2% |
0.6x |
125 |
7.0% |
|
BNY Mellon |
5.2% |
11.1% |
1.2x |
117 |
6.1% |
|
China Construction Bank (“CCB”) |
8.4% |
14.0% |
0.7x |
139 |
8.3% |
|
Credit Suisse |
4.7% |
12.4% |
0.7x |
184 |
4.1% |
|
Groupe BPCE |
4.7% |
15.5% |
N.A. |
165 |
5.1% |
|
Groupe Credit Agricole |
2.2% |
11.7% |
0.5x |
133 |
4.3% |
|
ING Bank |
5.1% |
14.6% |
0.8x |
123 |
4.4% |
|
Mizuho FG |
3.6% |
12.2% |
0.5x |
144 |
4.3% |
|
Morgan Stanley |
7.2% |
16.3% |
0.9x |
145 |
6.3% |
|
Royal Bank of Canada (“RBC”) |
4.5% |
11.9% |
1.9x |
123 |
4.4% |
|
Santander |
4.7% |
11.3% |
0.5x |
158 |
5.1% |
|
Societe Generale |
3.1% |
12.5% |
0.4x |
129 |
4.4% |
|
Standard Chartered |
5.2% |
13.5% |
0.6x |
154 |
5.1% |
|
State Street |
5.2% |
12.2% |
1.2x |
110 |
6.6% |
|
Sumitomo Mitsui FG |
4.7% |
16.2% |
0.5x |
131 |
4.7% |
|
UBS |
3.6% |
13.1% |
0.8x |
136 |
5.6% |
|
Unicredit Group |
5.7% |
12.6% |
0.5x |
151 |
5.0% |
|
Source: Company filings, Bloomberg, iFAST estimates Note: Basel III ratios may not be comparable as implementations vary across countries; data as of 3Q19 except for RBC, whose 3QFY19 period ended on 31 Jul 19. |
|||||
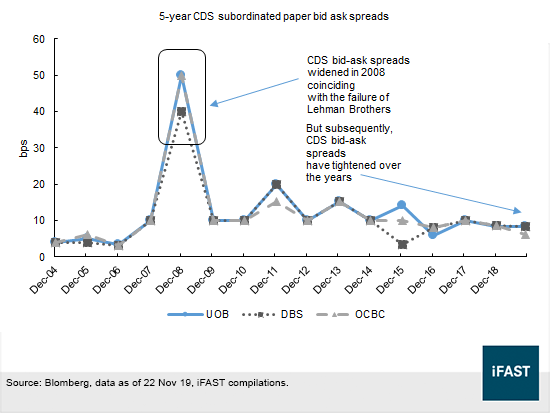
Observed spreads on credit default swaps (“CDS”) also provide a good indication of market appetite for a bank’s paper. Demand for a bank’s debt may be proxied by the 5-year CDS bid-ask spread, which is simply the difference between the ask and bid prices of the CDS contract. It is observed in Figure 10 that the CDS bid-ask spreads of Singapore banks widened considerably in 2008, but declined over the years since then, partially due to the improved credit quality and liquidity of bank subordinated debt. In 2008, the collapse of Lehman Brothers resulted in an uncertain outlook for the banking sector, creating a liquidity crunch.
Figure 10: Bid-ask spreads on 5-year credit default swaps
Singapore lenders have good liquidity profile
With the advent of the Global Financial Crisis, the failure of banks to control and manage their liquidity profiles has led to the introduction of two liquidity standards — the NSFR and LCR. The liquidity profiles of banks have since improved with the enforcements of these standards. Also, monetary policies around the world are easing and well supportive of increasing credit growth in the economies.
A bank’s liquidity profile is evaluated according to the group’s ability to access cash and whether if it is able to receive cash inflows from its liquid banking assets. The liquidity coverage ratio is a Basel III Pillar disclosure that computes the amount of high quality liquid assets (“HQLA”) over total net cash outflows over a 30-day period under a predetermined stress scenario. As of end-September, the LCR ratios of UOB (146%) and OCBC (152%) both surpassed DBS (131%).
Cash flows in the LCR denominator are adjusted for risk weights before final net outflows are calculated. These risk weights are assigned at the bank’s discretion, which is why we would like to supplement the LCR reading with another assessment of liquidity, namely the ratio of HQLA to tangible banking assets (“HQLA/TBA”). With this in mind, the HQLA/TBA ratios of all three Singapore banks showed an improvement from 3Q18 to 3Q19. The HQLA/TBA ratios of DBS, UOB, OCBC were 16.0% (3Q18: 15.0%), 15.1% (3Q18: 12.1%) and 12.4% (3Q18: 10.4%), all higher from the third quarter last year.
Our final liquidity measure is the NSFR, which expresses the bank’s available stable funding over its required stable funding. Put simply, the NSFR restricts lenders from relying excessively on unstable funding sources and incentivizes them to use more stable funding channels. As presented earlier in Table 1, the NSFRs of Singapore banks are above 100%, implying that the banks have more short-term stable funds relative to long-term illiquid assets. These ratios are above Basel and MAS minimums, reinforcing the fact that the liquidity profiles of UOB, OCBC and DBS are healthy.
Our thoughts about the issuer profiles at this juncture
Our discussion thus far leads us to have a slight preference towards UOB over OCBC and DBS in terms of its credit profile. Quite importantly, UOB has the smallest exposure to Hong Kong, a higher proportion of CET 1 capital to tangible banking assets and lower market risk exposure relative to CET 1 capital. Our top pick therefore is UOB among the three lenders, but considering the interconnectedness of the banking system and the equal likelihood of each lender receiving funding support from the central bank in times of need, we think there is very little difference that sets these banks apart at this point in time. We feel there is little default risk facing Singapore banks now so we would not have any qualms issuing a positive outlook for all three companies. Moreover, our comparison among G-SIBs and Singapore lenders in Table 2 shows that the domestic banks still have superior credit quality over some large systemically important banks.
Are Singapore bonds attractively priced?
In recommending the Singapore bank bonds, we looked primarily at their bond yields and key salient features. The number of outstanding Singapore bonds was estimated to exceed 340 but we narrowed our focus to the securities available on our platform, listed in Table 3 below. There are clearly various types of securities along the banks’ capital structure, ranging from additional tier 1 (“AT1”) perpetual bonds, covered bonds, preference shares, tier 2 instruments and senior unsecured debt. Senior unsecured debt are the highest ranked in the list, while AT1 bonds are becoming increasingly popular with bond investors due to their higher yield.
Table 3: Singapore bank securities
|
|
Basel III classification if applicable |
Optional call date if relevant |
Coupon rate |
Write down feature? |
Remarks |
|
DBSSP 4.700% Perp/Callable 2020 Pref (SGD) - Retail |
AT1 |
22 Nov 20 |
4.70% |
No |
Preference share |
|
DBSSP 3.980% Perpetual Corp (SGD) |
AT1 |
12 Sep 25 and each distribution payment date thereafter |
3.98% up to 12 Sep 25. 7Y SOR + 1.65% thereafter, resets every 7 years |
Yes |
Accounted for as shareholder's equity |
|
DBSSP 3.800% 20Jan2028 Corp (SGD) |
Tier 2 |
20 Jan 23 and each distribution payment date thereafter |
3.8% up to 20 Sep 23. 5Y SOR + 1.1% thereafter, resets once |
Yes |
Accounted for as part of liability |
|
DBSSP 2.780% 11Jan2021 Corp (SGD) |
N.A. |
N.A. |
2.78% |
N.A. |
Senior unsecured bond |
|
DBSSP 3.600% Perpetual Corp (USD) |
AT1 |
7 Sep 21 and each distribution payment date thereafter |
3.6% up to 7 Sep 21. 5Y SOR + 2.39% thereafter, resets every 5 years |
Yes |
Accounted for as shareholder's equity |
|
DBSSP 4.520% 11Dec2028 Corp (USD) |
Tier 2 |
11 Dec 23 and each distribution payment date thereafter |
4.52% up to 11 Dec 23. 5Y USD mid swap rate + 1.59% thereafter, resets once |
Yes |
Accounted for as part of liability |
|
OCBCSP 4.000% Perpetual Corp (SGD) |
AT1 |
24 Aug 23 and each distribution payment date thereafter |
4% up to 24 Aug 23. If not redeemed, 5Y SOR + 1.811% thereafter, resets every 5 years |
Yes |
Accounted for as shareholder's equity |
|
OCBCSP 3.800% Perpetual Corp (SGD) |
AT1 |
25 Aug 20 and any date after the first call date |
3.8% up to 25 Aug 20. If not redeemed, 5Y SOR + 1.51% thereafter, resets every 5 years |
Yes |
Accounted for as shareholder's equity |
|
OCBCSP 4.250% 19Jun2024 Corp (USD) |
Tier 2 |
Callable for taxation or regulatory reasons |
4.25% |
Yes |
Subordinated debt |
|
UOBSP Float 28Feb2023 Corp (GBP) |
N.A. |
N.A. |
3m Sterling Libor + 0.24% |
N.A. |
Covered bond |
|
UOBSP 3.580% Perpetual Corp (SGD) |
AT1 |
17 Jul 26 and each distribution payment date thereafter |
3.58% up to 17 Jul 26. If not redeemed, 7Y SOR + 1.795% thereafter, resets every 7 years |
Yes |
Accounted for as shareholder's equity |
|
UOBSP 3.500% 27Feb2029 Corp (SGD) |
Tier 2 |
27 Feb 24 |
3.50% |
Yes |
Accounted for as part of liability |
|
UOBSP 4.000% Perpetual Corp (SGD) |
AT1 |
18 May 21 and each distribution payment date thereafter |
4.0% up to 18 May 21. If not redeemed, 5Y SOR + 2.035% thereafter, resets every 5 years |
Yes |
Accounted for as shareholder's equity |
|
UOBSP 3.500% 22May2026 Corp (SGD) |
Tier 2 |
22 May 20 |
3.5% up to 22 May 20. If not redeemed, 6Y SOR + 1.607% thereafter |
Yes |
Accounted for as part of liability |
|
UOBSP 3.875% Perpetual Corp (USD) |
AT1 |
19 Oct 23 and each distribution payment date thereafter |
3.875% up to 19 Oct 23. If not redeemed, 5Y SOR + 1.794% thereafter, resets every 5 years |
Yes |
Accounted for as shareholder's equity |
|
UOBSP 3.500% 16Sep2026 Corp (USD) |
Tier 2 |
16 Sep 21 |
3.5% up to 16 Sep 21. If not redeemed, 5Y USD mid swap rate + 2.236% thereafter |
Yes |
Accounted for as part of liability |
|
UOBSP 2.880% 08Mar2027 Corp (USD) |
Tier 2 |
8 Mar 22 |
2.88% up to 8 Mar 22. If not redeemed, 5Y USD mid swap rate + 1.654% thereafter |
Yes |
Accounted for as part of liability |
|
UOBSP 3.750% 15Apr2029 Corp (USD) |
Tier 2 |
15 Apr 24 |
3.75% up to 15 Apr 24. If not redeemed, 5Y US Treasury rate + 1.5% thereafter |
Yes |
Subordinated debt |
|
N.A. |
N.A. |
2.85% |
N.A. |
Senior unsecured bond |
|
|
Source: Bond offering documents, company filings, iFAST compilations |
|||||
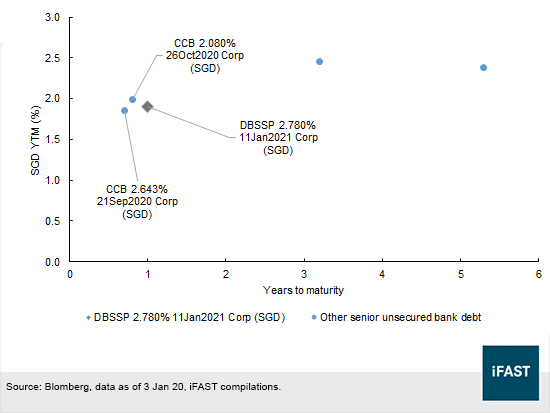
Among the senior unsecured bonds, we like the DBSSP 2.780% 11Jan2021 Corp (SGD) over UOB’s 3.2% ‘21s or OCBC’s 1.59% ’20s. The bond had the highest yield to maturity (“YTM”) among its peers as seen in Figure 11. With a YTM of 1.91% on 3 Jan 20, the senior unsecured note traded 53 basis points above the SGS 2.25% 01/06/2021. Outside the Singapore bank space (Figure 12), bond investors may also consider China Construction Bank’s (“CCB”) CCB 2.643% 21Sep2020 Corp (SGD) or CCB 2.080% 26Oct2020 Corp (SGD). CCB is one of the largest banks in China and has strong credit metrics as displayed in Table 2 above.
We think the tightness between the yields of senior SGD bank debt and Singapore sovereign bonds is a reflection of the high likelihood of government support for banks. To this note, Temasek Holdings (Private) Limited, a triple-A rated entity and manager of Singapore’s reserves, was listed as a 30% shareholder of DBS at the end of 2018.
Figure 11: Senior unsecured Singapore bank debt
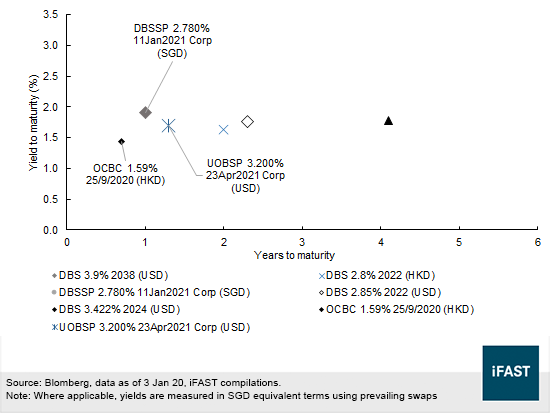
Figure 12: Senior unsecured SGD bank debt among all banks
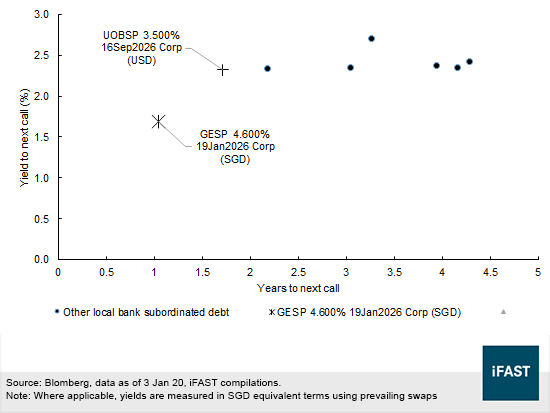
In the context of subordinated notes, we prefer the GESP 4.600% 19Jan2026 Corp (SGD) and UOBSP 3.500% 16Sep2026 Corp (USD) over other local bank credits. Many of the instruments in Figure 13 are Tier 2 instruments, or part of gone-concern capital. In other words, Tier 2 instruments absorb losses in an insolvency situation before depositors and other more senior creditors, but after AT1 noteholders. In addition, the standards for Tier 2 eligibility are less stringent than those for AT1 as they allow bonds with a fixed maturity date to be included. In the Basel III framework, all AT1 notes must be perpetuals.
UOBSP 3.5% ’26s has a write-down clause where the loss absorption is conducted on a pro-rata and proportionate basis with all other Tier 2 capital securities. If the bank drops below the point of non-viability, MAS will notify UOB as a trigger for the write-down mechanism of the note. We also like the
GESP 4.600% 19Jan2026 Corp (SGD) (callable in January 2021) for its reasonable yield to next call of 1.68% on 3 Jan 20. The issuer Great Eastern Life Assurance Co Ltd (Singapore) is the insurance subsidiary of OCBC and we believe it will have strong parent support in the event of financial difficulty.
Figure 13: Callable subordinated Singapore bank debt
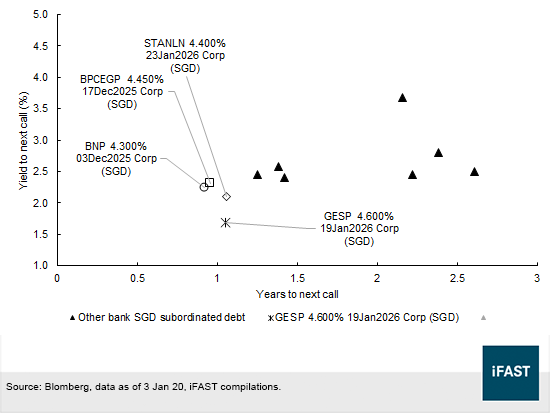
When viewed against other foreign issuers, the yield to next call of GESP 4.6% ’26s was comparatively lower than other European bank credits (Figure 14). Similar bonds such as Standard Chartered’s 4.4% ’26s, BNP 4.3% ‘25s and BPCEGP 4.450% 17Dec2025 Corp (SGD) have bond yields in excess of 2% on 3 Jan 20. Standard Chartered Plc, or STANLN is an international, global systemically important bank with its headquarters in London; BNP Paribas is the biggest bank in France; and BPCE SA is part of the second largest French banking group, Groupe BPCE.
Figure 14: Subordinated SGD bank debt
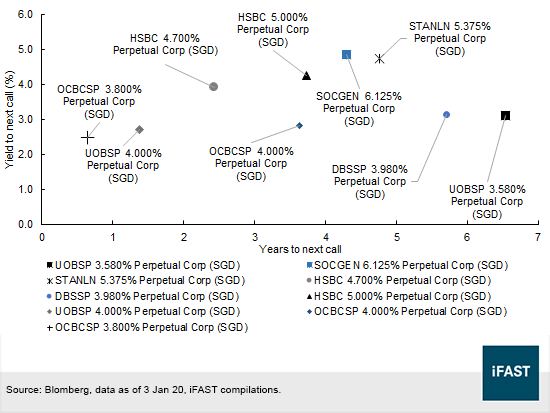
Moving down along the payment ranks and up the credit risk ladder, we compared the perpetual securities of all SGD bank issuers and noticed that foreign bank issues had higher YTCs (Figure 15). A number of these perpetuals qualify as Basel III-compliant AT1 instruments, as indicated in Table 3. However, one key difference between the foreign and local financial institution groups is that foreign banks’ SGD perpetuals have an embedded convertible loss-absorption mechanism in a restructuring event outside liquidation or resolution.
As highlighted in our earlier article on perpetual contingent convertible instruments (“CoCos”), the credit risk of these notes are twofold — the default risk of the issuer and the risk of the issuer’s capital position breaching the conversion point, which in most cases is fixed at a CET 1-to-RWA ratio of 7%. For this reason, the key risk of AT1 CoCos is largely a function of the distance between the bank’s current CET 1 ratio to the trigger level.
Our preferred perpetual among SGD non-convertible AT1s is the HSBC 4.700% Perpetual Corp (SGD), as well as the OCBCSP 3.800% Perpetual Corp (SGD) among the three local banks, for its decent yield and short duration. We would be equally inclined to recommend the other local SGD perpetuals but the HSBC 4.7% perp currently offers the best value in our view. Unlike foreign bank perps such as those of HSBC or Standard Chartered PLC, the write-down feature of the OCBC 3.8% perp is triggered by the central bank, similar to the Tier 2 instruments mentioned above.
Figure 15: Yields to next call of SGD bank perpetuals
Are Singapore bank bonds close to risk free?
The answer to the question hinges on the definition of risk free. If we define sovereign bonds as a risk-free asset, then Singapore senior bank debts are indeed trading close to risk-free levels. However, the concept of risk free is somewhat flawed in finance because there is an inherent risk in nearly everything, be it a financial or real asset. In a fiat monetary system, the currency is as valuable as the sovereign entity printing the money; even deposits at some point are prone to bank runs. Perceived safe-haven real assets such as gold are also susceptible to price fluctuations and are therefore not risk-free.
That aside, we are positive on the Singapore banking sector as these local institutions have a stronger capital position than a decade ago. The credit profiles are linked to the Singapore government and the banks have largely resolved bad loans from the oil-and-gas segment. In spite of improved asset quality, persistently low interest rates would undoubtedly affect net interest margins, but we think that loan growth should remain steady and non-performing loans manageable. With Singapore’s reputation of one of the safest financial system in the world, we think the local banks could see more inflows especially on the wealth management side of the business.
Declaration:
For specific disclosure, at the time of publication of this report, IFPL (via its connected and associated entities) has a principal position in HSBC 4.700% Perpetual Corp (SGD) and DBSSP 3.600% Perpetual Corp (USD). The analyst who produced this report hold a NIL position in the abovementioned securities.